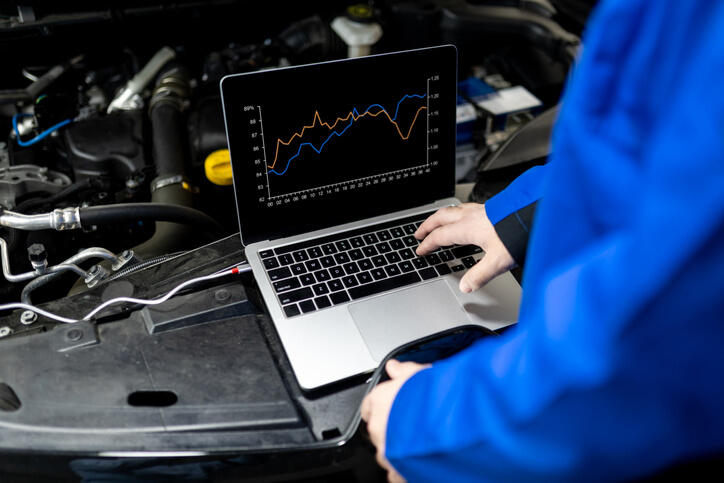
The Role of Scan Tool Graphing in Complex Auto Mechanic Diagnostics
When today’s vehicles roll into the garage with a check engine light or a strange misfire, gone are the days of relying on guesswork. Complex auto mechanic diagnostic problems now require high-level tools and skills, and one of the most valuable is scan tool graphing. This essential diagnostic technique helps modern mechanics decode real-time vehicle data, and it’s a key skill taught at our auto mechanic school.
This blog explains how scan tool graphing works, why it matters, and how future technicians benefit from mastering it during automotive training.
What Is Scan Tool Graphing?
Scan tool graphing allows technicians to visualize live data from a vehicle’s computer systems in real time. Instead of looking at raw numbers or diagnostic trouble codes alone, a scan tool displays the performance of systems such as oxygen sensors, throttle position sensors, fuel trims, and more using dynamic graphs.
Think of it like a heart monitor for a car. Instead of just seeing a single data point, you get a full story of how a system is behaving over time. This is crucial for diagnosing intermittent issues or systems that operate within “acceptable” but suboptimal ranges.
Why Graphing Is Better Than Static Data
A traditional scan tool might show a snapshot of sensor data, but that’s often not enough to uncover hidden problems. Here’s why scan tool graphing is a diagnostic game-changer:
- Visual Trends: Graphs reveal trends and fluctuations that static data can’t.
- Comparison: Graphs make it easier to compare sensor behavior side-by-side.
- Timing: Pinpoint exactly when and under what conditions a fault occurs.
In real-life scenarios, a misfire that only happens under load or a sensor that spikes intermittently won’t show up on a still image. Graphing brings those events to light.

Applications in the Auto Mechanic Field
Let’s say a customer complains of sluggish acceleration. Static code scanning might show no active faults. However, graphing the mass airflow sensor (MAF) or throttle position sensor could reveal a delayed or inconsistent signal, something only visible through real-time visualization.
At ATC Surrey, students learn to isolate these issues using scan tool graphing during hands-on labs. The program integrates diagnostic practice into real vehicle repairs, preparing students for what they’ll face in busy shops.
Scan Tool Graphing as a Core Skill
As emissions standards tighten and electrical systems become more sophisticated, diagnostic skills are at the forefront of technician training. Understanding how to read, interpret, and act on live sensor data puts you ahead of the curve as a professional auto mechanic.
That’s why our automotive training program doesn’t just skim over diagnostics. It immerses students in scenarios where scan tool graphing is not just helpful, it’s essential. Students learn to:
- Select the proper parameters to graph
- Compare baseline readings with the manufacturer’s specs
- Interpret graph patterns to uncover sensor lag, electrical resistance, or data drops

Learning the ATC Way
Every auto mechanic school may offer diagnostic tools, but at ATC Surrey, instructors guide students through practical troubleshooting with real vehicles. That means making real-time decisions based on real-world data, just like in the field.
By the time students complete their program, scan tool graphing isn’t just a lesson; it’s second nature. And that’s what employers want.
As vehicle systems grow more complex, having a strong grasp of scan tool graphing will set you apart in the job market. If you’re considering a future as an auto mechanic, make sure your training includes modern diagnostics, especially graphing techniques that reveal what’s hidden from static data.
Are you looking for comprehensive automotive training?
Contact ATC Surrey for more information.


